Dashboard puts focus on energy use and saving
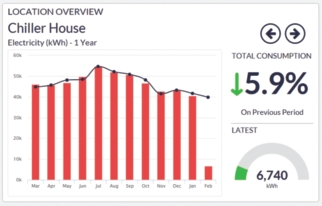
The eSight Envi energy dashboard from eSight Energy displays engaging and interactive energy data. It provides an accessible solution to enable organisations to understand and promote energy performance. The interface enables companies to monitor energy consumption, navigate sites and promote savings. It is ideal for public display or accessible from a personal device.
Its capabilities include canvas mapping ability that enables users to create an interactive location map relating to their site or building from any image for fast and simple navigation through multiple locations. KPI (key performance indicators) ranking tables also enable users to acknowledge top-performing sites or departments and encourage participation in energy efficiency.
A summary page collates total energy, CO2 and cost data for all locations — with performance indicators and percentage savings.
The rich functionality of Envi is contrasted with the extremely simple configuration tool that enables non-technical users to create customised dashboard very quickly. The dashboards can be accessed by unlimited users from a browser with a unique URL.